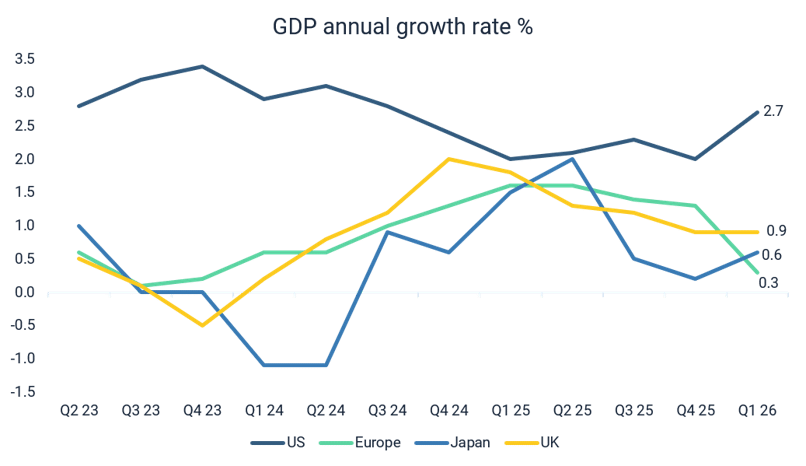
Global economic growth broadly slowed in the first half of 2026 but remains positive. This slowdown was primarily driven by the conflict in the Middle East, where the effective closure of the Strait of Hormuz pushed oil above $100 a barrel, straining energy supply chains and reigniting inflation concerns.[1] The UK, the fastest-growing G7 economy in Q1, lost momentum as the shock fed through, with forecasters ranking it among the advanced economies most exposed to higher energy prices.[2] The US remained the most resilient, with Q2 growth tracking around 2% annualised, driven by AI and technology investment and cushioned by lower external energy dependency. Economic growth in the Eurozone, Japan and China stayed relatively subdued, with energy-importing Europe and Japan especially vulnerable to an extensive oil price surge.
Investment conditions

Source: Saltus, Trading Economics
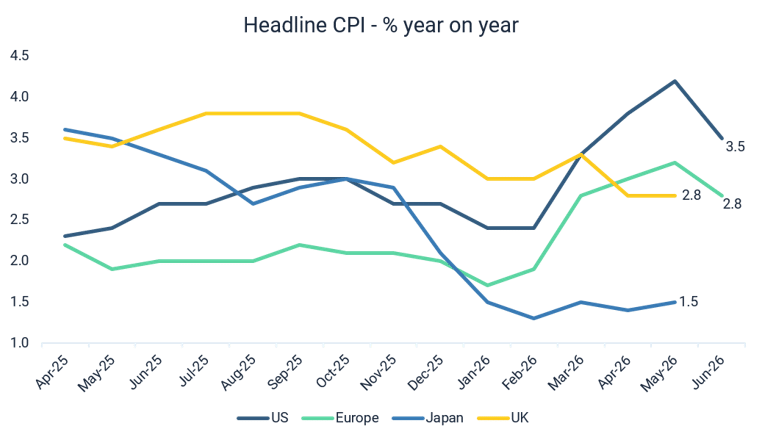
Inflation across major advanced economies has been driven up by the energy shock, and subsequently down, as a temporary ceasefire was established. The US saw the sharpest move, with annual inflation easing to 3.5% from 4.2% – the first slowdown in five months — as the US–Iran ceasefire brought energy prices down.[3] The Euro Area followed, easing to 2.8% but still above the ECB’s 2% target.[4] The UK has been stickier, with inflation holding at 2.8%,[5] while Japan remains the outlier on the low side, below the Bank of Japan’s target – though the BoJ still raised rates in June.[6] With tension in the Middle East still volatile, the direction of travel for global inflation remains a key watch-point.
Source: Saltus, Trading Economics
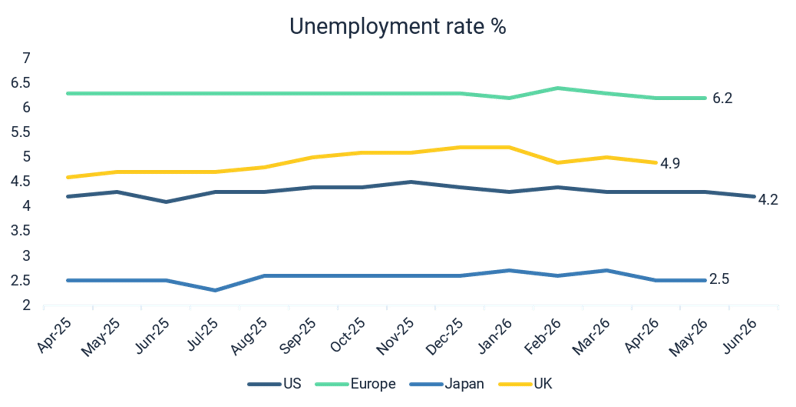
Labour markets are beginning to diverge, though the shared theme is cooling hiring momentum rather than outright collapse. The US slowed in June, adding far fewer jobs than expected; unemployment dipped to 4.2%, but mainly because more people stopped looking for work. The Euro Area sits at record-low joblessness of 6.2%, though youth unemployment remains high and national gaps are wide – from under 4% in Germany to over 10% in Spain. The UK is the softest, with unemployment at 4.9%, vacancies at a five-year low and youth unemployment at a decade high. Japan stays tightest, close to full employment, though hiring there is easing at the margin too. Taken together, these are labour markets past their peak but not yet in distress.
Source: Saltus, Trading Economics
Central bank policy has been defined by the energy shock, which has halted and in places reversed the prior easing cycle. The Federal Reserve held its policy rate at 3.75% in April and June, and June’s meeting removed its earlier bias toward cuts. The European Central Bank raised its deposit rate from 2.0% to 2.25% in June – its first hike since September 2023. The Bank of England held Bank Rate at 3.75% in April and June, with the vote to hold narrowing from 8–1 to 7–2 as two members backed a hike. The Bank of Japan raised its policy rate to 1.00% in June, its highest since 1995.
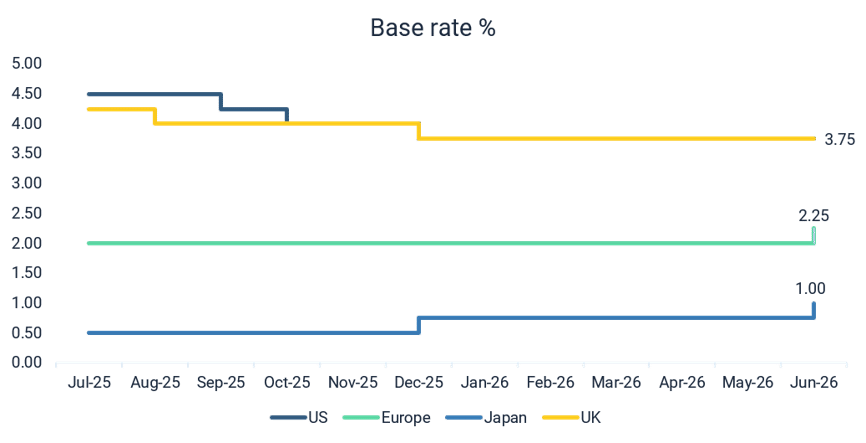
Source: Saltus, Trading Economics
The Q2 2026 US earnings season opened in mid-July with expectations set unusually high. Forecasts anticipate S&P 500 earnings growth of around 22-23%, which would mark a second straight quarter above 20%[7]. The large Wall Street banks opened the earning season strongly last week with JPMorgan, Goldman Sachs, Bank of America, Citigroup and Wells Fargo all beating expectations, with Goldman recording its best quarter ever and JPMorgan’s profits up 41% year on year, driven by trading and investment banking. Big Tech (Alphabet, Microsoft, Meta, Apple and Amazon) reports later in July, with Nvidia due in late August. Attention will be on whether these companies are beginning to reap the rewards from the AI investments they have made in recent years.
Market Themes
The AI capex reckoning
For the past two years the story in Big Tech has been a simple one: the more a company committed to AI data centres and chips, the more investors rewarded it. That story is now shifting.
The numbers involved are extraordinary. Goldman Sachs estimates the large cloud players will spend roughly $725 billion on AI infrastructure this year alone, with Amazon approaching $200 billion, Microsoft and Alphabet around $180–190 billion each, and Meta between $125 and $145 billion. These rank among the largest corporate investment programmes in history.
But all this spending begs the question of when these companies will begin to profit from their investments, and we have begun to see the capital expenditure on AI related infrastructure ease slightly.
As such, the emphasis has shifted. Investors are less interested in the size of the cheque and more in the evidence that it is working. That means watching a few things closely: cloud growth, margin sustainability, and, most telling of all, whether the large user bases for AI tools are converting into paying revenue rather than remaining a promising signal that has yet to show up in the numbers.
The market has moved on from asking how much these companies are betting to asking what they are winning.
From cuts to hikes: how the rate story turned
Not long ago the main question for many investors was how many times central banks would cut rates this year. Coming into 2026 the answer seemed fairly settled: central banks had spent the back half of 2025 loosening policy – the Fed cut three times, the ECB was well into an easing cycle, and the Bank of England had trimmed rates in December – the direction of travel appeared clear.
Then the momentum changed. The energy shock from the conflict in the Middle East early in the year pushed oil prices higher, and inflation followed. What had looked like a gentle glide back towards the 2% target began to reverse, and the narrative around interest rates shifted with it.
A key turning point came in June. The Federal Reserve, under its new chair Kevin Warsh, kept interest rates on hold but made clear the mood had changed. Its latest projections showed most policymakers now expect rates to end this year higher than they are today, with almost all of them more worried about inflation rising than falling.
This is not only an American story. The European Central Bank raised rates in June for the first time since 2023, with markets now leaning towards two further hikes over the next year. The Bank of England’s tone has hardened each meeting, and the Bank of Japan has lifted rates to a 31-year high.
For anyone accustomed to the low-rate era, this is a meaningful shift. The assumption that the next move is always likely to be down may no longer be a safe one. That said, much still depends on the data – and this month’s slightly cooler US inflation print, may have been a relief to Kevin Warsh, but was a reminder that the story could yet change direction again.
Views by asset class

Equities
We opened the committee meeting by asking whether we remain comfortable with the overall level of ‘risk-on’ exposure in portfolios. That is, the mix of equities alongside our high-yield and emerging market debt allocations, which we also regard as risk-seeking asset classes. We concluded that we are comfortable with our current risk and the discussion then turned to the equity allocation itself, and whether its breadth and underlying factor exposures are where we want them.
That led to the meeting’s main focus – how best to play a potential ‘broadening out’ of markets – rotating away from the overarching concentration risk that has come to dominate equity markets. We are sceptical that this narrow market can generate supernormal returns as it has done in recent years, but optimistic that other parts of the market can offer opportunity. Having reviewed the portfolio’s positioning, we remain comfortable with our overall level of equity risk, so the changes that follow are about the composition of that exposure.
The first change is an addition to US small caps, funded by a partial reduction in our broad US large cap exposure. We see an attractive combination of more compelling valuations and a supportive earnings-growth outlook in the small-cap space given the resilience and strength of the US consumer. This addition sits naturally within the broadening-out thesis as market leadership widens beyond the largest index constituents.
The second is a rotation of our factor exposure away from quality and towards more defensive sectors. The idea began with the specific opportunities we saw in healthcare valuations, but we concluded the theme is better expressed through a broad defensive allocation – spanning consumer staples, utilities and healthcare – rather than a single dedicated position in one sector.
Alternatives
Within alternatives, the committee discussed the potential longer-term opportunity in natural resource linked equities, particularly within the critical materials area – where there are strong positive supply and demand drivers. The committee opted not to take a position this time but will continue to monitor the opportunity.
The committee then discussed the position held in gold mining equities. A key driver behind holding gold mining equities in our highest risk portfolios has been to benefit from an improvement in underlying company fundamentals driven by a rise in the underlying gold price. Gold mining equities have historically seen amplified moves in the gold price, rising or falling by roughly twice the percentage change in gold, and so are more naturally suited to a higher risk portfolio. Recognising a shifting backdrop, earlier in the year we took profits, halving our position, and now, given deteriorating near term fundamentals driven by higher real yields, alongside a less bullish technical setup at present for the underlying gold price, the decision was made to exit the position. We continue to allocate to gold bullion in lower-risk portfolios as a diversifier, helping to reduce reliance on traditional assets such as equities and bonds.
Fixed Income
Within fixed income, our central question this quarter was whether to increase our exposure to longer-dated government bonds as a diversifier, potentially in place of some of our risk-off alternatives. The case for doing so is that interest rates have risen in recent months to a level where these bonds now offer an attractive yield. They could also provide a useful offset in an economic slowdown. If growth faltered and equity prices fell, central banks would typically cut rates, which would push bond prices up just when the rest of the portfolio was struggling.
The complication is inflation. With price pressures building again, we see a real risk that rates rise further from here rather than fall, and in a stagflationary environment central banks would have little room to cut even if growth weakened. That combination undermines the very protection longer-dated bonds are meant to provide. On balance, we remain more comfortable holding alternatives rather than fixed income as our source of defensive ballast.
Summary of positioning

Below is a summary of our views for each asset class, from strongly negative (- -) to strongly positive (+ +).
Asset Class
| Asset class | -- | - | Neutral | + | ++ |
|---|---|---|---|---|---|
| Equities | X | ||||
| Government bonds | X | ||||
| Corporate bonds | X | ||||
| Alternatives | X | ||||
| Cash | X |
Asset Class Breakdown
| -- | - | Neutral | + | ++ | ||
|---|---|---|---|---|---|---|
| Equities | USA | X | ||||
| UK | X | |||||
| Europe | X | |||||
| Japan | X | |||||
| Asia ex-Japan | X | |||||
| Emerging markets | X | |||||
| Bonds | US Government | X | Non-US Government | X | ||
| Inflation-Linked Government | X | |||||
| Investment Grade Corporate | X | |||||
| High Yield Corporate | X | |||||
| Emerging Market Debt | X | |||||
| Alternatives | Commodities | X | ||||
| Gold & Gold Miners | X | |||||
| Property | X | |||||
| Global Macro | X | |||||
| Equity Long/Short | X | |||||
| Absolute Return | X | |||||
| Infrastructure | X | |||||
| Currency | Sterling | X | ||||
| US Dollar | X | |||||
| Euro | X | |||||
| Japanese Yen | X | |||||
| Emerging Markets | X |
Fund in focus: Carbon Cap: World Carbon Fund

Fund objective
The World Carbon Fund aims to generate a positive absolute return on any 12-month rolling basis, whilst moving independently of equity and bond markets. It does this by investing in carbon allowance markets, also known as Emission Trading Systems (ETS). Within an ETS, companies are included by law and must purchase permits to account for the emissions they produce. These allowances can be purchased at auction or traded in the secondary market, allowing the World Carbon Fund to invest in the asset class. The fund invests across the largest and most liquid of these markets, covering the EU, UK, US and New Zealand.
How are carbon markets priced?
In short, supply and demand. Supply is a policy decision. Governments cap the total number of permits that are auctioned each year and tighten that cap over time, reducing the number of allowances available to purchase. A shrinking supply tends to have a positive impact on prices and therefore incentivises companies to decarbonise rather than pay a higher price for their emissions. Demand moves with the real economy and with energy markets, as stronger industrial activity or higher gas prices mean more emissions and so greater demand for permits, while an economic slowdown or a shift to cleaner energy pulls the other way. Each market sets its own cap, rules and coverage and their prices tend not to move in step – one of the reasons a fund spread across all four can act as a diversifier.
How it is run
The fund is managed by Carbon Cap, a specialist firm established in 2018 that focuses solely on this strategy. The team is led by founder Michael Azlen, alongside his chief operating officer, head of research and close-knit group of analysts.
The approach is methodical and data driven. Each month the team scores every carbon market on a consistent set of measures – price trends, whether a market looks cheap or expensive, and the direction of government policy. Those scores guide where the fund invests and how much risk it takes. In practice the fund runs two engines side by side. One takes longer-term positions in markets it finds attractive, while the other seeks smaller, steadier gains from shorter-term opportunities.
Performance
Since the fund launched in 2020, it has returned 16% per annum and – importantly – it has done so with a low correlation to the other alternative asset classes in the portfolio, as well as traditional bonds and equities8. This is a useful characteristic to have for positions in a multi asset class portfolio – when shares or bonds have wobbled, this fund has not necessarily wobbled with them, which is exactly what you want from a diversifier.
However, it is not immune to setbacks and performance can be volatile. Over the first quarter of 2026 the fund fell 16%, the majority of which came in January and February whilst equity markets were broadly performing well. The fund proceeded to make 34% over the second quarter of 2026 as the manager was able to take advantage of short term noise whilst long term fundamentals remained intact, positioning the portfolio for a rebound (Source: Bloomberg). From a fundamental standpoint, Carbon Cap believe the outlook for these markets is the most promising in many years.
Role in your portfolio
We hold the World Carbon Fund for two reasons. The first is diversification: its returns come from a very different source – the gradual tightening of carbon markets, plus the manager’s skill – so it tends to behave differently from equities and bonds, helping to smooth the ride when conventional markets struggle. The second, and equally important, is its return potential. We expect it to be competitive with equities over the long term, so we do not hold it purely for its diversification benefits – we own it as a genuine engine of growth to drive positive portfolio performance.
Asset Allocation Committee

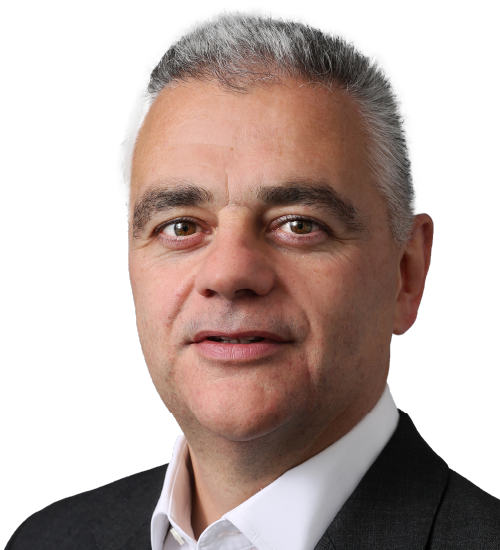
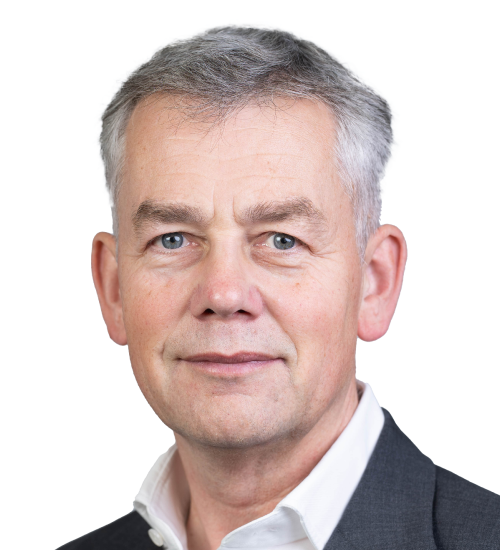
The committee consists of several senior members of the investment team, all partners, who invest their own money alongside clients. The committee consists of:




Article sources
Editorial policy
All authors have considerable industry expertise and specific knowledge on any given topic. All pieces are reviewed by an additional qualified financial specialist to ensure objectivity and accuracy to the best of our ability. All reviewer’s qualifications are from leading industry bodies. Where possible we use primary sources to support our work. These can include white papers, government sources and data, original reports and interviews or articles from other industry experts. We also reference research from other reputable financial planning and investment management firms where appropriate.
The views expressed in this article are those of the Saltus Asset Management team. These typically relate to the core Saltus portfolios. We aim to implement our views across all Saltus strategies, but we must work within each portfolio’s specific objectives and restrictions. This means our views can be implemented more comprehensively in some mandates than others. If your funds are not within a Saltus portfolio and you would like more information, please get in touch with your adviser. Saltus Asset Management is a trading name of Saltus Partners LLP which is authorised and regulated by the Financial Conduct Authority. Information is correct to the best of our understanding as at the date of publication. Nothing within this content is intended as, or can be relied upon, as financial advice. Capital is at risk. You may get back less than you invested. Tax rules may change and the value of tax reliefs depends on your individual circumstances.