Do you need help managing your investments?
Our team can recommend an investment strategy to meet your financial objectives and give you peace of mind that your investments are in good hands. Get in touch to discuss how we can help you.

We have a long track record of producing superior risk-adjusted returns. This has been in part due to consistently identifying managers who outperform their benchmarks.

We can measure the excess return generated by each manager we use over their benchmark and compare it to the costs of investing with that manager. For our middle risk band, active portfolio, the results over the last 9 years are summarised in Chart 1 below.

Chart 1: Manager Excess Return vs Cost
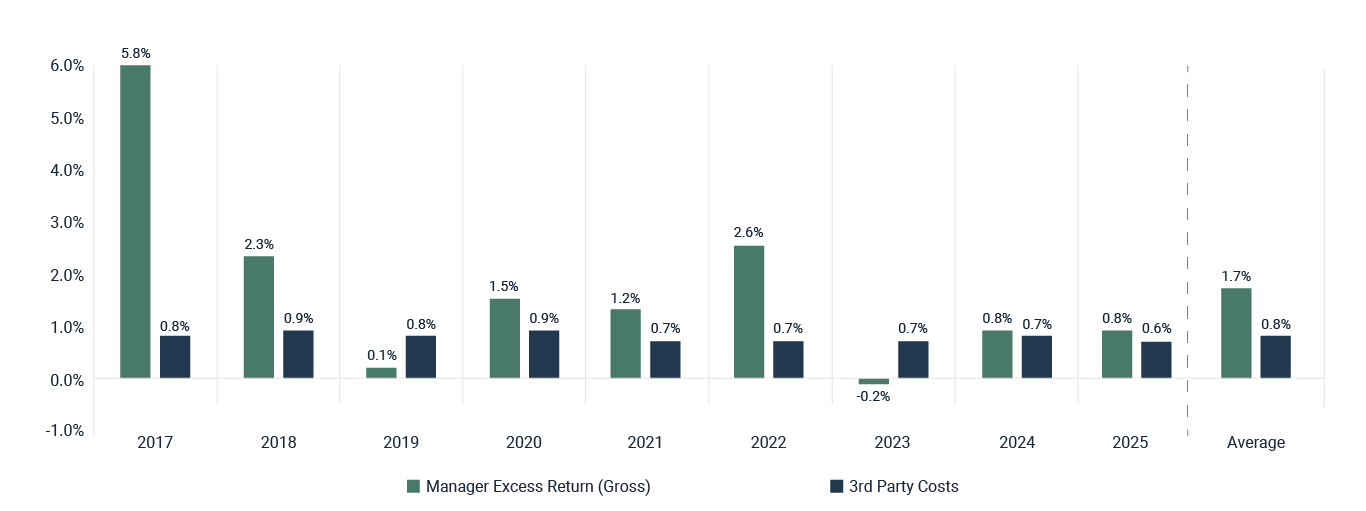
Source: Bloomberg/Saltus. Full calendar years from 2017 – 2025. We measure the gross excess return generated by each manager we use over their benchmark and compare it to the costs of investing with that manager. This is then multiplied by the amount of our portfolio invested with that manager at the start of each month to determine the results. Performance is quoted net of third-party manager fees, the Saltus Asset Management DFM Fee and the Saltus platform fee. Past performance is not a guide to the future. Investments do not guarantee a return, the value and the income from them can fall as well as rise. You may not get back the amount originally invested.
Chart 1: Manager Excess Return vs Cost
Source: Bloomberg/Saltus. Full calendar years from 2017 – 2025. We measure the gross excess return generated by each manager we use over their benchmark and compare it to the costs of investing with that manager. This is then multiplied by the amount of our portfolio invested with that manager at the start of each month to determine the results. Performance is quoted net of third-party manager fees, the Saltus Asset Management DFM Fee and the Saltus platform fee. Past performance is not a guide to the future. Investments do not guarantee a return, the value and the income from them can fall as well as rise. You may not get back the amount originally invested.
Chart 2 shows where we derive our gains from. We show the net outperformance versus competitors and show what proportion of this came from asset allocation decisions, and what proportion came from manager excess return, or ‘skill’ The peer group benchmark is the ARC Private Client Indices. More information on the benchmark can be found at the bottom of the page.

Chart 2: Manager Excess Return and Asset Allocation
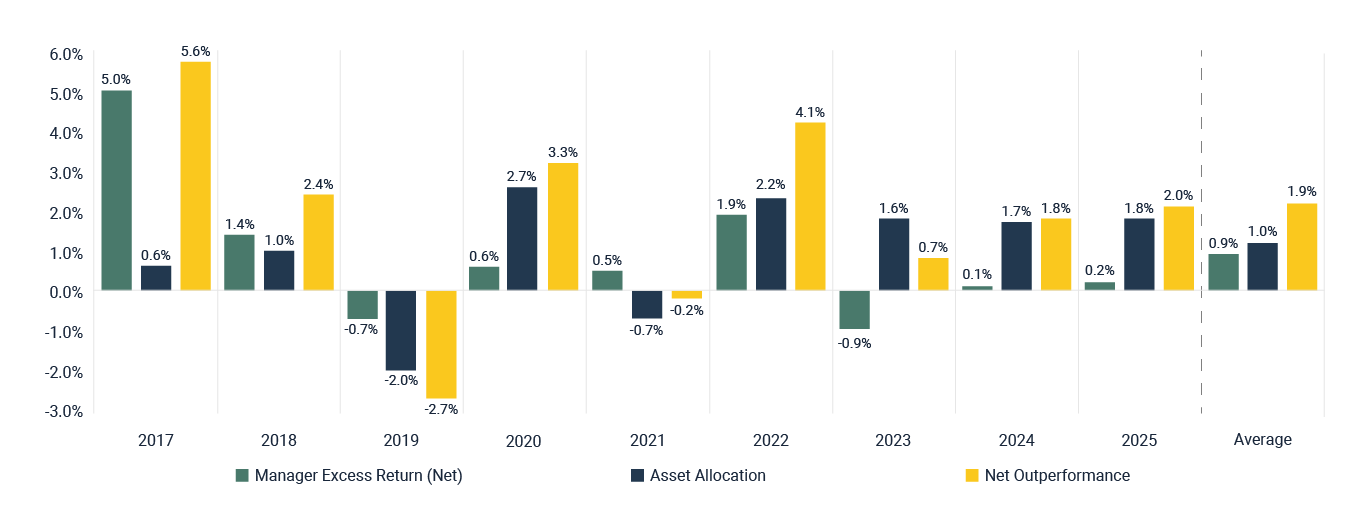
Source: FE Analytics/Saltus. Full calendar years from 2017 – 2025. Performance is quoted net of third-party manager fees, the Saltus Asset Management DFM Fee and the Saltus platform fee. Net Outperformance is shown versus the Balanced ARC PCI benchmark. Asset allocation is calculated as the difference between manager excess return in any given year and the benchmark return for that year. Past performance is not a guide to the future. Investments do not guarantee a return, the value and the income from them can fall as well as rise. You may not get back the amount originally invested.
Chart 2: Manager Excess Return and Asset Allocation
Source: FE Analytics/Saltus. Full calendar years from 2017 – 2025. Performance is quoted net of third-party manager fees, the Saltus Asset Management DFM Fee and the Saltus platform fee. Net Outperformance is shown versus the Balanced ARC PCI benchmark. Asset allocation is calculated as the difference between manager excess return in any given year and the benchmark return for that year. Past performance is not a guide to the future. Investments do not guarantee a return, the value and the income from them can fall as well as rise. You may not get back the amount originally invested.
The combination of effective manager selection and nimble unconstrained asset allocation has resulted in outperformance versus our competitors.
Chart 3 provides overall discreet performance for our middle risk band portfolio, the ‘Saltus MAC Balanced (PA)’ portfolio, versus the ARC peer group. This is shown alongside the return on cash over the same period.

Chart 3: Annual Performance vs ARC
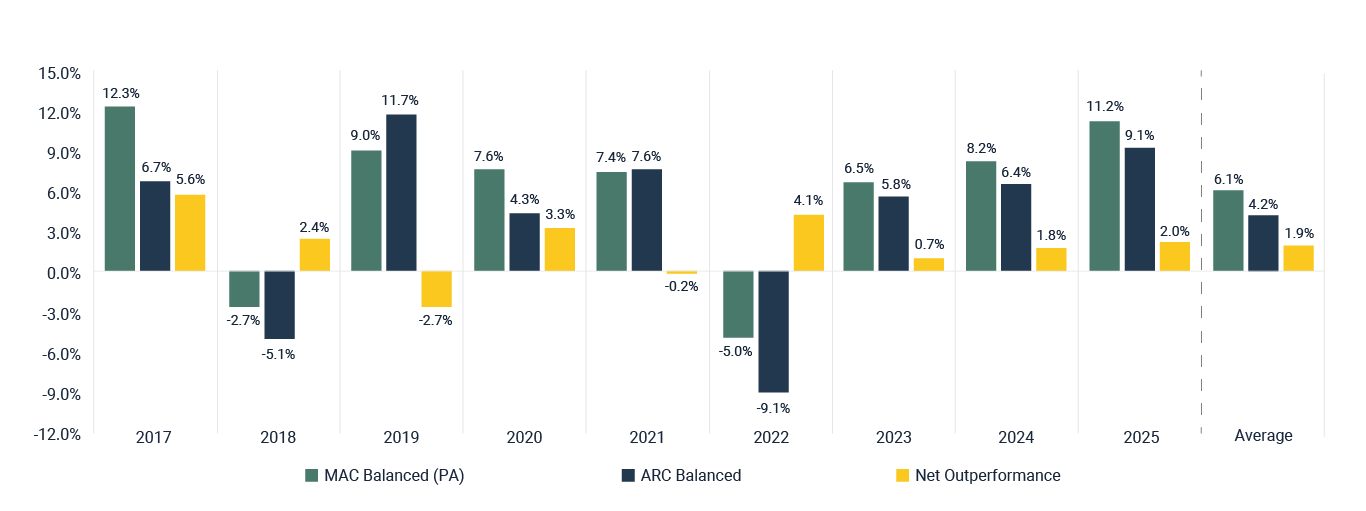
Source: FE Analytics/Saltus. Full calendar years from 2017 – 2025. Performance is quoted net of third-party manager fees, the Saltus Asset Management DFM Fee and the Saltus platform fee. Past performance is not a guide to the future. Investments do not guarantee a return, the value and the income from them can fall as well as rise. You may not get back the amount originally invested.
Chart 3: Annual Performance vs ARC
Source: FE Analytics/Saltus. Full calendar years from 2017 – 2025. Performance is quoted net of third-party manager fees, the Saltus Asset Management DFM Fee and the Saltus platform fee. Past performance is not a guide to the future. Investments do not guarantee a return, the value and the income from them can fall as well as rise. You may not get back the amount originally invested.
ARC (Asset Risk Consultants) provide an independent benchmark that assesses us against all of our competitors. We have no input on the benchmark and how the data is presented. The Indices are the only market benchmarks composed of real results from real investor accounts—a total of 350,000 investment portfolios from over 140 firms. “The Indices are the definitive guidepost for good investment performance under any condition” – ARC.
Nearly every major Wealth Manager in the UK is included in the benchmark. For a list of all the firms included, please click here.
Our team can recommend an investment strategy to meet your financial objectives and give you peace of mind that your investments are in good hands. Get in touch to discuss how we can help you.
Investment management
We are unconstrained, multi-asset class investors with an award winning track record. The asset management team serves both institutions and individuals. This focus and experience means our UK private clients have access to superior investment solutions that are typically unavailable to retail clients.
Investment process
Our team of experts will partner with you to tailor a suitable investment mandate with an appropriate risk budget. Our Asset Allocation Committee shapes the core components of our investment portfolios before assigning capital to various asset classes through an allocation to third party managers.
Sustainable investing
We believe in responsible investment management, and so assess Environmental, Social and Governance (ESG) factors are assessed prior to making any investment decision. We then continue to work closely with third party managers on an ongoing basis to improve their ESG performance.
Professionals
Our expert investment management team has an established history of working in partnership with professional intermediaries. We help provide the support your clients may need and understand the requirements of each separate case prior to designing a suitable investment strategy.

