Fraud Blocker Asset allocation update September 2025 : How we're thinking about markets... | Saltus

Asset allocation update

Share this article:

Asset allocation update How we're thinking about markets...

19 November 2025

Share this article:
Investment Process funnel diagram

Investment conditions

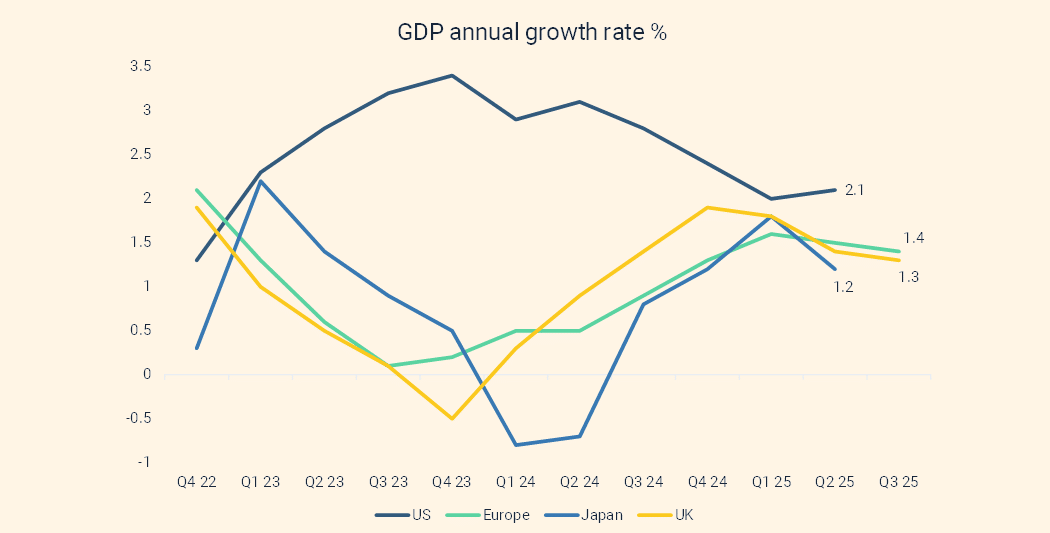
The major economies continue to see positive economic growth, however, growth rates are slowing.[1] In the US, economic growth has exceeded expectations, with little negative impact from Trump’s tariffs evident so far.[2] Capital spending on data centres to enable AI models has driven a significant proportion of the growth. Following the longest US government shutdown in history, some key economic data for September and October is missing which makes forecasts difficult. In the other major developed economies, growth rates are slowing, having recovered through 2024. Expectations are for a continuation of this trend – slowing GDP growth, but not to recessionary levels.[3]

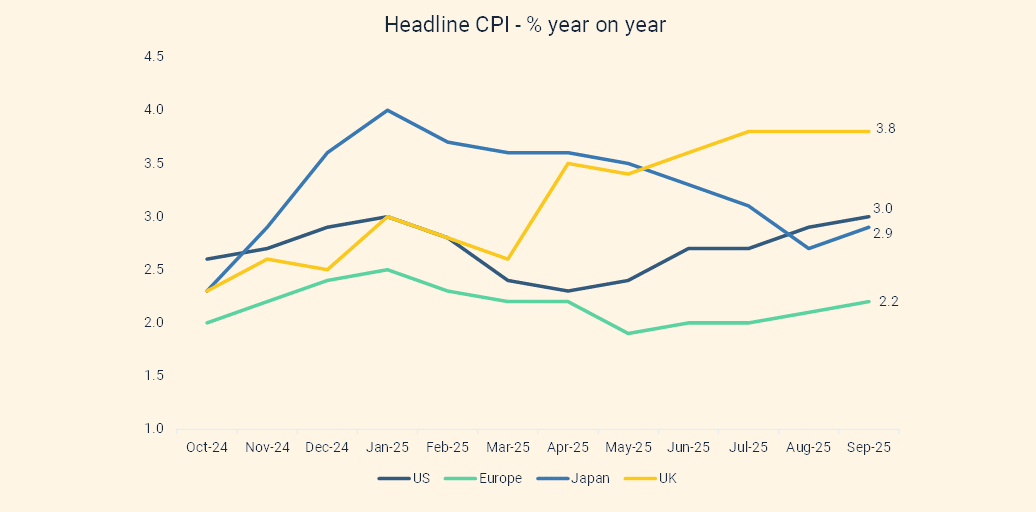
The picture is mixed on inflation. Headline CPI has been rising for the last four months in the US and is forecast to be over 3% by the end of 2025. Tariffs are expected to send inflation higher in the short term, but the impact should be temporary. The UK is also experiencing sticky inflation. UK headline CPI is almost twice the Bank of England’s 2% target. In Europe, inflation has been hovering around target for the last few months but has slowly started to move up again as we move towards the end of the year. Japan has had a much-needed reduction in inflation, and China is still battling with outright deflation.

Source: Saltus, Trading Economics

Unemployment is still near historic lows in the developed economies. This is supporting healthy wage growth, which is bolstering the consumer. A buoyant consumer has been a key pillar of economic growth and earnings growth in this cycle. The US labour market looks like it is slowing down though, and this is a closely watched indicator to signal if the US economy is going to experience a protracted economic slowdown. The UK labour market looks weak, due to many of the growth-negative tax rises that have taken place over the last year.

The only central bank action of note during the period was two consecutive 0.25% cuts by the Fed. The Bank of England was split between holding rates and cutting by another 0.25% at their recent meeting, voting marginally in favour of holding.[4] Rates are being held steady in Europe and Japan.

Source: Saltus, Trading Economics

Third quarter corporate earnings results were robust. Corporates are still in a healthy position supported by resilient economies, positive consumers and rising wages. US technology companies were strong, but there was more dispersion between companies during this quarter, with the market starting to tire of the huge capital expenditure announcements. Looking forward, analysts expect 12.1% earnings growth for global equities over the next 12 months. Regionally, Emerging Market earnings are forecast to grow quickest over the next 12 months, at 17.5%, with Asia ex-Japan corporate earnings also forecast to grow strongly at 14.6%. The UK and Europe have more subdued forecasts at 8.8%, and 8.2% respectively, but across the board the expectation is that 2026 will be another strong year for corporates. These regions all trade in line with their long term averages on a price to earnings multiple, whereas the US remains overvalued. This consensus earnings and valuation data is taken from Bloomberg.

Market Themes

Dizzying heights

One doesn’t have to look very hard to find a stock market index that has hit record highs in 2025. So far this year we have seen a synchronised rally in the world’s major stock markets, driven by strong economic growth, a resilient consumer, falling interest rates, and more certainty over US trade policy.

In the US, all four of the major stock market indices have recently made new highs.[5] The S&P500, the Dow Jones Industrial Average, the Nasdaq 100 and the Russell 2000 have recently been in the record books, showing just how broad-based the positivity has been. We all know the story of US technology firms and their stratospheric growth, but the Russell 2000 is comprised of the smallest 2000 stocks on the market. These firms have rallied on the expectation of interest rate cuts from the Fed, as they tend to be heavily dependent on short term financing and so are particularly sensitive to prevailing rates.

In Asia, the dominant indices in Japan (Nikkei 225) and South Korea (KOSPI) have hit all-time highs, as well as the lesser known Singaporean Straits Times Index.[6] These have been driven by many of the same tailwinds. In South Korea especially, there is a large exposure to the AI theme through semiconductor makers. More on Japan below.

Closer to home, the FTSE 100, the DAX in Germany, and the CAC 40 in France have been riding high. At the European-wide level too, the Stoxx 50 and the Stoxx 600 have broken through previous peaks. The FTSE 100 is dominated by international companies, with a focus on commodity and pharmaceutical companies. Looking at the domestically focused FTSE 250 or FTSE 350, the gains have been nowhere near as impressive.

Interestingly, for all the AI-dominance headlines, the S&P500 has been one of the worst performing major stock markets this year.[7] A break from previous years of dominance.

IndexCountry2025 Performance*IndexCountry2025 Performance*
S&P500US15%DAXGermany19%
NASDAQ 100US19%CAC 40France10%
Dow Jones IAUS11%FTSE MIBItaly28%
Russell 2000US7%IBEX 35Spain40%
Nikkei 225Japan26%STOXX 600Europe12%
CSI 300China17%FTSE 100UK19%
KOSPISouth Korea70%FTSE 200UK5%

Source: Saltus, Bloomberg (100 – 09/09/22)

Takaichi takes charge

At the end of October, Japan’s parliament elected the country’s first female prime minister, Sanae Takaichi.[8] The stock market hit record highs soon after as the market expects her pro-growth agenda to include easy fiscal policy, more defence spending, a revival of Japan’s nuclear power industry, and a preference for low interest rates.

On the other side of this, the Japanese yen weakened sharply, and government bonds sold off. The key for the yen will be if she can influence the Bank of Japan to keep rates low, but given the Bank of Japan is independent, this may not be the case. There is a strong relationship in Japan between the currency and the stock market. Historically, a weak currency has been a positive for the stock market, as Japan is an open economy dominated by exporting companies, who are helped by a weaker yen.

Takaichi is also expected to press ahead with the corporate governance reforms that have been taking place in Japan for a few years now. Japan has many listed companies, and they suffer from excessive capacity and competition. As a result, companies, especially small companies, are cheap.[9] Takaichi is expected to push on with reforms already in place to increase consolidation, shareholder returns, private equity purchases, and through this, valuations. We have long held a positive view on Japanese equities for a combination of an improving macroeconomic backdrop and corporate-level backdrop. Takaichi’s election has enhanced these views.

Source: Saltus, Bloomberg, Trading Economics

Views by asset class

Equities

The committee was happy to leave the equity allocation broadly unchanged given their comfort with current themes and exposures. The equity allocation is currently balanced between US and non-US exposure, at almost 50/50. This is significantly lower than the global stock market, where US equities constitute 65% of the market.

Within our US equity book, we have a more diversified exposure, with less focus on the AI-driven companies. We have run our US equities like this intentionally for almost two years now, which in hindsight has been early, but we are comfortable with this due to concentration concerns. Going into 2026, the earnings and cash flow growth of these AI-driven behemoths will likely fall relative to the wider market, and investors are going to scrutinise the capital expenditure plans of these companies a lot more closely. Investors are going to want to start seeing a return on this investment.

In the other half of the equity book, we have a significant tilt towards emerging market equities (with a focus on Asia), frontier market equities, and Japanese equities. Emerging and frontier markets have some of the highest earnings growth forecasts, and lowest valuations of all regions. They are being supported by a weaker dollar, falling inflation, interest rate cuts, and more inter-region trade with China. As mentioned in the section above, we continue to have a positive view on Japanese equities, and our exposure here targets value stocks and small companies as we believe the potential upside in these areas to be significant. These positions make up around 30%, with the remaining 20% split equally between UK and Europe.

Bonds

We maintain a relatively low exposure to government bonds given debt concerns in a number of developed markets, combined with sticky inflation. Where we do have exposure, we are keeping our duration (interest-rate sensitivity) low to reflect these concerns.

Most of our government bond exposure is in the UK. We see the UK as ‘the cleanest dirty shirt’, given the focus on fiscal conservatism, and given that the bond market is quick to discipline the government’s spending intentions. The UK government relies on foreign investors to purchase its debt and doesn’t have the luxury of the US government whose debt is typically always in high demand. Therefore, the UK government must tread carefully, and it is also keen not to repeat the mistakes of Liz Truss. Even though the fiscal position of the UK government is weak, we are confident the government will make every effort to meet its fiscal commitments, which is positive for gilts.

In our US government debt exposure, we only have inflation-protected bonds, which have performed well recently, given the inflationary dynamics of the US economy.

In corporate bonds, we have minimal exposure to investment grade bonds. Given slim spreads (the extra yield above lending to the government), investment grade bond prices are heavily influenced by government bond yields, and we are nervous here. We continue to hold exposure to high yield bonds.

A bright spot has been our exposure to emerging market debt. We like this asset class given higher yields on offer, less debt sustainability issues, and tailwinds from a weaker dollar and looser monetary policy. Similar reasons to our overweight positioning in emerging market equities.

Alternatives and Currency

Within our diversified alternatives exposure, the committee decided to reduce exposure to UK infrastructure due to higher conviction in other parts of the alternatives book.

We maintain our positive view on gold, gold miners and copper. Copper is attractive currently given the long term demand dynamics, combined with the lack of investment in new supply. This exposure may also offer protection should we have a reflationary episode, where other parts of the portfolio may struggle.

Elsewhere in the alternatives book, we are increasing our exposure to the macro hedge theme. This is the part of the portfolio that should benefit from increased volatility in markets. An example of a fund we use in this space is given in the Fund in Focus section below.

The committee did not make any notable changes to our currency exposure. Our largest non-sterling active currency exposure is to the Japanese yen given the diversification benefit on offer. The Japanese yen tends to appreciate in times of market stress, giving the portfolio an element of downside protection.

Summary of positioning

Below is a summary of our views for each asset class, from strongly negative (- -) to strongly positive (+ +).

Asset Class

Asset class -- - Neutral + ++
Equities X
Government bonds X
Corporate bonds X
Alternatives X
Cash X

Asset Class Breakdown

-- - Neutral + ++
Equities USA X
UK X
Europe X
Japan X
Asia ex-Japan X
Emerging markets X
Bonds US Government X
Non-US Government X
Inflation-Linked Government X
Investment Grade Corporate X
High Yield Corporate X
Emerging Market Debt X
Alternatives Commodities X
Gold & Gold Miners X
Property X
Global Macro X
Equity Long/Short X
Absolute Return X
Infrastructure X
Currency Sterling X
US Dollar X
Euro X
Japanese Yen X
Emerging Markets X

Fund in focus: Trium Alternative Growth Fund

Summary

The Trium Alternative Growth Fund targets specific sources of return across the asset class spectrum which can provide capital growth that is independent of market direction. We see this as a ‘low risk’ fund that has consistently demonstrated good performance in volatile markets, without having a negative return in steady markets.

The fund’s aim is to generate capital growth whilst exhibiting low correlation to equity markets over a rolling three year period. The fund should have the ability to deliver strong performance in stressed markets. Since its inception, it has proved successful in performing positively in down markets.

Given the fund’s ability to provide uncorrelated returns, it has been a core part of our alternative asset class exposure. As traditional assets have become more correlated, the need for diversification has increased. This part of the portfolio should reduce overall volatility, and improve risk adjusted returns.

Trium and the team

Trium Capital LLP is a boutique fund house, consisting of a suite of alternative portfolio managers focused on delivering returns with a low correlation to markets. Trium focuses on portfolio managers who aspire to run their own funds and build consistent track records but may lack experience in managing a business or implementing institutional-level risk controls.

Trium was founded in 2015, and now assists 8 investment teams, and 28 investment professionals. The Trium Alternative Growth Fund was launched in September 2021 and has £120m assets under management.

Toby Hayes is the portfolio manager, supported by Deepak Baghla as co-portfolio manager. Toby has over 20 years of experience, and before joining Trium in 2021, he was a fund manager for the Fortem Alternative Growth Fund. Previously, Toby was a portfolio manager for Franklin Templeton, managing alternative and traditional multi-asset funds. Toby was also a partner for Pacific Investments developing various alternative strategies, and before this, he was a founding partner at Armstrong Investment Managers, a multi-asset boutique where he managed global macro portfolios.

Deepak has over 15 years of systematic research and trading experience. Previously he managed macro-systematic books as a PM at Morgan Stanley, EDF Trading, Millenium Partners and Symmetry Investment.

Investment philosophy and process

The Trium Alternative Growth fund looks to invest in alternative premia, which are sources of return embedded within traditional asset classes, and which are already present in most multi-asset portfolios. By stripping out the asset class beta (broad market exposure), the alternative premia can be isolated and invested in separately. The strategy selects only those risk/returns that are structural in nature, and discards those that have shown a propensity to correlate in risk-off markets.

The strategy uses five premia, across equities, credit (corporate bonds), rates (government bonds) & currencies, and commodities. The five premia that they use either have a negative correlation to equities or a neutral correlation.

Without delving too far into the complexities of the strategy, or the exposures of the fund, the key point is that this strategy should perform if markets are more volatile, and indeed it has done in the four years since its inception. Importantly though, in stable markets the fund should perform positively, so unlike traditional tail-hedges (or portfolio insurance), an investor doesn’t have to pay a premium to hold it.

Performance

The fund aims to achieve cash + 3-4% per annum, with a 3-5% volatility. Since inception in 2021, the fund has returned around 3.5% a year on average, with a volatility of 3.5%.

These returns may sound unexciting, but the chart below shows the performance of the fund in the 19 negative months for the global stock market (MSCI World) since its inception. You can see an impressive hit rate for the fund performing positively when stocks (dark blue bars) and bonds (grey bars) are negative.

It is also useful to look at 2025 performance. In the chart below, the green line is the performance of global equities over the year, and the blue line is the performance of Trium Alternative Growth. During the market turmoil around ‘Liberation Day’ in April 2025, the fund performed very well as stock markets fell and has continued to trend upwards for the rest of the year, rather than giving back all its gains.

Saltus rationale

This fund is a core part of our diversified alternatives exposure as it is uncorrelated to other parts of the portfolio.

We see this as a ‘low risk’ fund, that has consistently demonstrated good performance in volatile markets, without having a negative return in steady markets.

Asset Allocation Committee

The committee consists of several senior members of the investment team, all partners, who invest their own money alongside clients. The committee consists of:

Article sources

Editorial policy

All authors have considerable industry expertise and specific knowledge on any given topic. All pieces are reviewed by an additional qualified financial specialist to ensure objectivity and accuracy to the best of our ability. All reviewer’s qualifications are from leading industry bodies. Where possible we use primary sources to support our work. These can include white papers, government sources and data, original reports and interviews or articles from other industry experts. We also reference research from other reputable financial planning and investment management firms where appropriate.

The views expressed in this article are those of the Saltus Asset Management team. These typically relate to the core Saltus portfolios. We aim to implement our views across all Saltus strategies, but we must work within each portfolio’s specific objectives and restrictions. This means our views can be implemented more comprehensively in some mandates than others. If your funds are not within a Saltus portfolio and you would like more information, please get in touch with your adviser. Saltus Asset Management is a trading name of Saltus Partners LLP which is authorised and regulated by the Financial Conduct Authority. Information is correct to the best of our understanding as at the date of publication. Nothing within this content is intended as, or can be relied upon, as financial advice. Capital is at risk. You may get back less than you invested. Tax rules may change and the value of tax reliefs depends on your individual circumstances.

Get in touch